The most dynamic economic sectors that have the best prospects for growth and capital appreciation are the least represented in the S&P 500 in our opinion. This is due in part to investor neglect and lack of conviction in the current investment cycle. Below are some of the sectors we continue to favor along with their notable lack of appropriate representation:
Sector / Industry
S&P Weighting
Energy:
10.20%
Coal
0.00%
Industrials:
Defense
2.50%
Machinery
1.63%
Railroads
0.81%
Materials:
Construction
0.07%
Metals & Mining
0.28%
Gold
0.22%
Steel
0.28%
Our view of the domestic and world economy has changed little in over three years, and we continue to find value in the critical areas listed above. Over this period we have often been asked if our investments should continue to be held. We continue to believe that the underlying fundamentals that are driving these investments will be longer lasting than many consider to be possible. Furthermore, Wall Street’s fascination with strict diversification without adequately considering the actual investment fundamentals or economic merit hinders the opportunity for success by limiting the investment in critically important areas. Consequently many investors are destined to experience only average returns. As these sectors become more popular their weighting in the S&P 500 will inevitably increase.
Macro Forces Support Commodity Prices
The prices for many basic materials such as iron ore, copper, nickel and zinc are higher than they have been in over twenty years. Today’s business cycle is different from past cycles due to the emergence of China and India as growing industrial economies and the fact that high prices are not able to stimulate the capacity additions that are needed to meet rising demand at this time. Moreover, multinational producers are facing a growing trend toward nationalization of their foreign-owned assets at a time when there already is a scarcity of major discoveries, long lead times for new projects, and labor and equipment shortages. In addition, the nearly three decades of corporate and government under-investment further exacerbates this challenging environment.
Gold
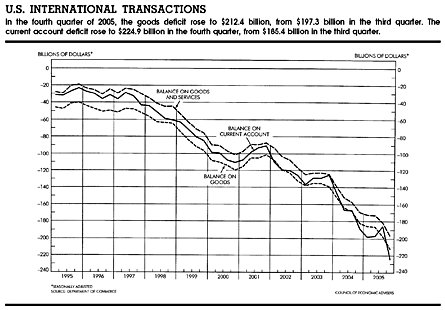
Gold is currently trading at more than $700 per ounce, up over 45%, from $485 at the beginning of the year. Providing support for gold prices are the U.S. government’s fiscal deficit, our large and growing trade deficit (highlighted on the chart on the next page) and pressure on the U.S. dollar. Furthermore, foreign economies that depend on exports are determined to prevent their currencies from rising against the U.S. dollar. Under these circumstances the purchasing power of many fixed-income assets such as bonds will be further eroded over time. Furthermore, the demands for non-financial hard assets that can be used as a hedge against currency depreciation remain in place. Exchange Traded Funds (ETFs) backed by precious metals now provide a new instrument for individual investors and institutions to hedge their investment portfolios if they believe that the U.S. dollar might come under further pressure. Additionally the physical demand for gold from countries like China and India is strong, reflecting their burgeoning economic growth and the increasing wealth of their citizens. At the same time gold production is estimated to decline worldwide.
The U.S. Treasury department, by not citing China as a currency manipulator in its recent report, is in effect encouraging the decline of the dollar thereby putting upward pressure on the price of gold. This, in combination with the new availability of ETFs, encourages further investment and trading interest. If U.S. investors alone were to allocate just 1% of their investment portfolios to gold as an asset class, it would equate to the purchase of over $100 billion worth of the metal. By contrast the entire gold industry worldwide mines 88.2 million ounces per year and at $700 this equates to only $62 billion. In this case, U.S. investment demand would equal 1.6 times all the gold mined in a single year. In this context it is not surprising to see the price of the metal rising.
Nationalism, Rebels And Rogue Regimes
The most resource rich areas are in some of the most unstable or volatile countries. Whether it is in Africa, Asia, Latin America, or the Middle East, we face difficult challenges. Below is a table highlighting some of the resource rich countries where new projects are being sought or developed:
Country
Resource
Challenge
Bolivia
Gas, Oil, Silver, Tin
Expropriation, Not honoring contracts
Chad
Oil
Civil war, Corruption
Iraq
Oil, Gas
War, Sabotage
Iran
Oil, Gas, Uranium
Saber rattling, Politicizing exports
Indonesia
Oil, Gas, Nickel, Copper, Zinc, Gold
Political instability, Labor strikes, Corruption
Nigeria
Oil, Gas, Rubber
Rebel Insurgency
Peru
Copper, gold, zinc, Silver
Political uncertainty, Labor unrest
Russia
Oil, Gas, titanium
State Seizure & Control
Sudan
Oil, Gas
Civil War, Corruption, Genocide
Venezuela
Oil, Gas, bauxite
Expropriation, Not honoring contracts
As the world economy’s dependence on these resources grows, the governments of these countries are able to exert political influence they had not had before. Furthermore, as the prices of commodities rise, there is a tendency for resource-rich nations to change the terms of previously negotiated contracts. This diminishes the projected returns for multinational companies and causes them to rethink further investment in these troubled areas. As a result lower risk properties in the U.S are now getting higher valuations. As an example of this, in a recent transaction, a U.S.-based energy company purchased proven, developed oil reserves in Texas for approximately $22 per barrel. Similar transactions previously had been completed at $15-$18 per barrel. Superimposing this increased valuation on U.S. energy assets, many companies’ equities would be selling at greater premiums to today’s market values.
Strong Dynamics Support Our Favored Sectors
There are three major themes that support industrial activity in the world:
The building, upgrading, maintenance and repair of infrastructure in developed nations
The expansion of global industrial capacity
The construction of new infrastructure to raise living standards in developing nations
Developed nations are in need of maintenance and repair after decades of under investment in their infrastructures. In the U.S. alone, the spending of the recently passed $283 billion highway bill is just beginning to take effect. In addition the American Society of Civil Engineers estimates that $1.6 trillion will have to be spent over the next five years on our infrastructure including roads, bridges, dams, rails, sewers, hospitals and schools. This does not include the rebuilding from hurricanes Rita and Katrina, nor does it anticipate future spending on national disasters. We note that the hurricane season is upon us once again. Western Europe also is in need of maintaining its vast infrastructure, while at the same time the new EU entrants in Eastern Europe are upgrading and expanding their infrastructures.
The International Monetary Fund last week raised its forecast for world growth for both 2006 and 2007 (see chart on next page). The growth estimated for 2006 alone will add another $2.28 trillion in the trade of goods and services. This represents 1.27 times the size of the entire Chinese economy of $1.79 trillion as measured in 2005. It is in this context that additional capacity must be able to accommodate this extraordinary expansion.
The commercial construction market has begun a strong recovery, while highway-building activity has increased due in part to the new transportation bill. The companies that comprise the cement and aggregates industry are positioned to post record revenues and earnings in 2006. In response to these favorable market conditions, the cement makers have increased prices to offset higher energy, transportation and labor costs. We would not be surprised to see additional price increases during the year. In addition the hurricane damage in the Gulf has contributed to the incremental demand for cement and aggregates.
Industrial Equipment
Worldwide growth would not be possible without an increase in industrial equipment. Industrial construction for manufacturing, transportation, electric power generation, oil & gas production and refining facilities, is on the increase, and the severe hurricane damage in the Gulf is keeping demand strong for earth-moving machines and backup power generating equipment. After decades of under investment, there is a shortage of equipment and labor. The recent article in the New York Times on the tire shortage for large industrial vehicles used in mining touches on the current shortage that is unlikely to be relieved before 2009. This is an example of one of the many challenges that face industrial companies in their attempts to expand production. We believe parts, labor and materials shortages will have the effect of extending the cycle as current production rates are unable to satisfy demand. Therefore we expect the revenues, earnings and free cash flow for companies in this industry to continue to rise for a considerable period of time.
Energy
The energy sector currently comprises 10.20% of the S&P 500 index and yet it contributes over 14% of the S&P 500 earnings. As the earnings contribution continues to increase, we should see further expansion of the energy sector’s weighting in the index. What is notable here is that this sector has been garnering a great deal of attention in recent years, is essential to the growth of the global economy, has no near-term supply/demand solutions in sight, and yet is far from the 25%+ S&P 500 representation it achieved in 1980. The difference today is that we have a secular global demand-driven market, whereas in 1980 we experienced only a short term U.S. supply-driven shortage partially orchestrated by OPEC.
Global demand continues to rise steadily, and oil & natural gas prices should remain at a high level. There are no cost-effective alternatives to replacing oil and natural gas in the global economy at present. The development of clean, cost-effective and energy-efficient technologies could, over time, make a significant difference in U.S. energy consumption. However most of these technologies are years away from being broadly implemented. In the meantime demand continues to rise while at the same time instability in Nigeria, Iraq, Iran and Venezuela are troublesome.
Economic growth in South East Asia, China, India, Brazil, Russia, and Eastern Europe should continue to add to market tightness and support high prices. China and India in particular will continue to increase energy consumption to further their rapid economic expansions. Moreover, consumers in the U.S. and developed nations have not curbed their appetites for energy even at these higher price levels.
Coal
The coal industry is well positioned both domestically and internationally. In the U.S., electric utility inventories of approximately 105 million tons registered an historic low. This is nearly 37% below the 15-year average at the end of 2005. Between 2005 and 2030 U.S. coal demand is expected to grow from 1.1 billion tons per year to 1.8 billion tons per year. According to the U.S. Energy Information Agency, an additional 190 million tons per year will be in demand for converting coal to other fuels such as diesel by 2030. According to the U.S. Department of Energy, 135 domestic power plants have been announced or are under construction representing 80 gigawatts of electricity. This will require an investment of over $100 billion. It is notable that coal is becoming more accepted as clean-coal technologies are adopted.
Railroads
The importation of Asian goods through West Coast ports remains one of the key drivers of growth for the railroad industry. Additionally coal shipments are also strong and continue to be the railroads’ most profitable cargo. Coal volumes are expected to rise over 10% in 2006. Rising diesel costs have had only a modest impact on the railroads’ profitability due in part to effective hedging strategies, fuel surcharges and the use of more efficient locomotives. Further support of growth for the railroads is the emerging truck driver shortage. It is estimated that there will be a shortage of 110,000 drivers over the next five years. Strong customer demand and tight capacity are supporting additional freight rate increases, and the railroads will also raise prices in 2006 and 2007 as long-term contracts come due and are renegotiated at higher rates.
Conclusion
Short of a global recession, which we do not see at this time, the U.S. energy, industrial and materials sectors remain some of the most compelling investment areas both from a valuation standpoint and from the view that this is an extended cycle likely to last through the decade. Furthermore, this is unlike recent cycles in that higher prices are not stimulating sufficient capacity additions to meet rising demand. Moreover, many companies in these sectors remain attractive and undervalued while their earnings and cash flows continue to increase significantly. We also anticipate that further merger and acquisition activity should raise equity valuations as companies deploy their growing cash balances, and private equity funds invest their capital. In the meantime, we expect continuing dividend increases, stock splits, and share repurchases for many of our investments as these companies continue to benefit from their strong outlooks.